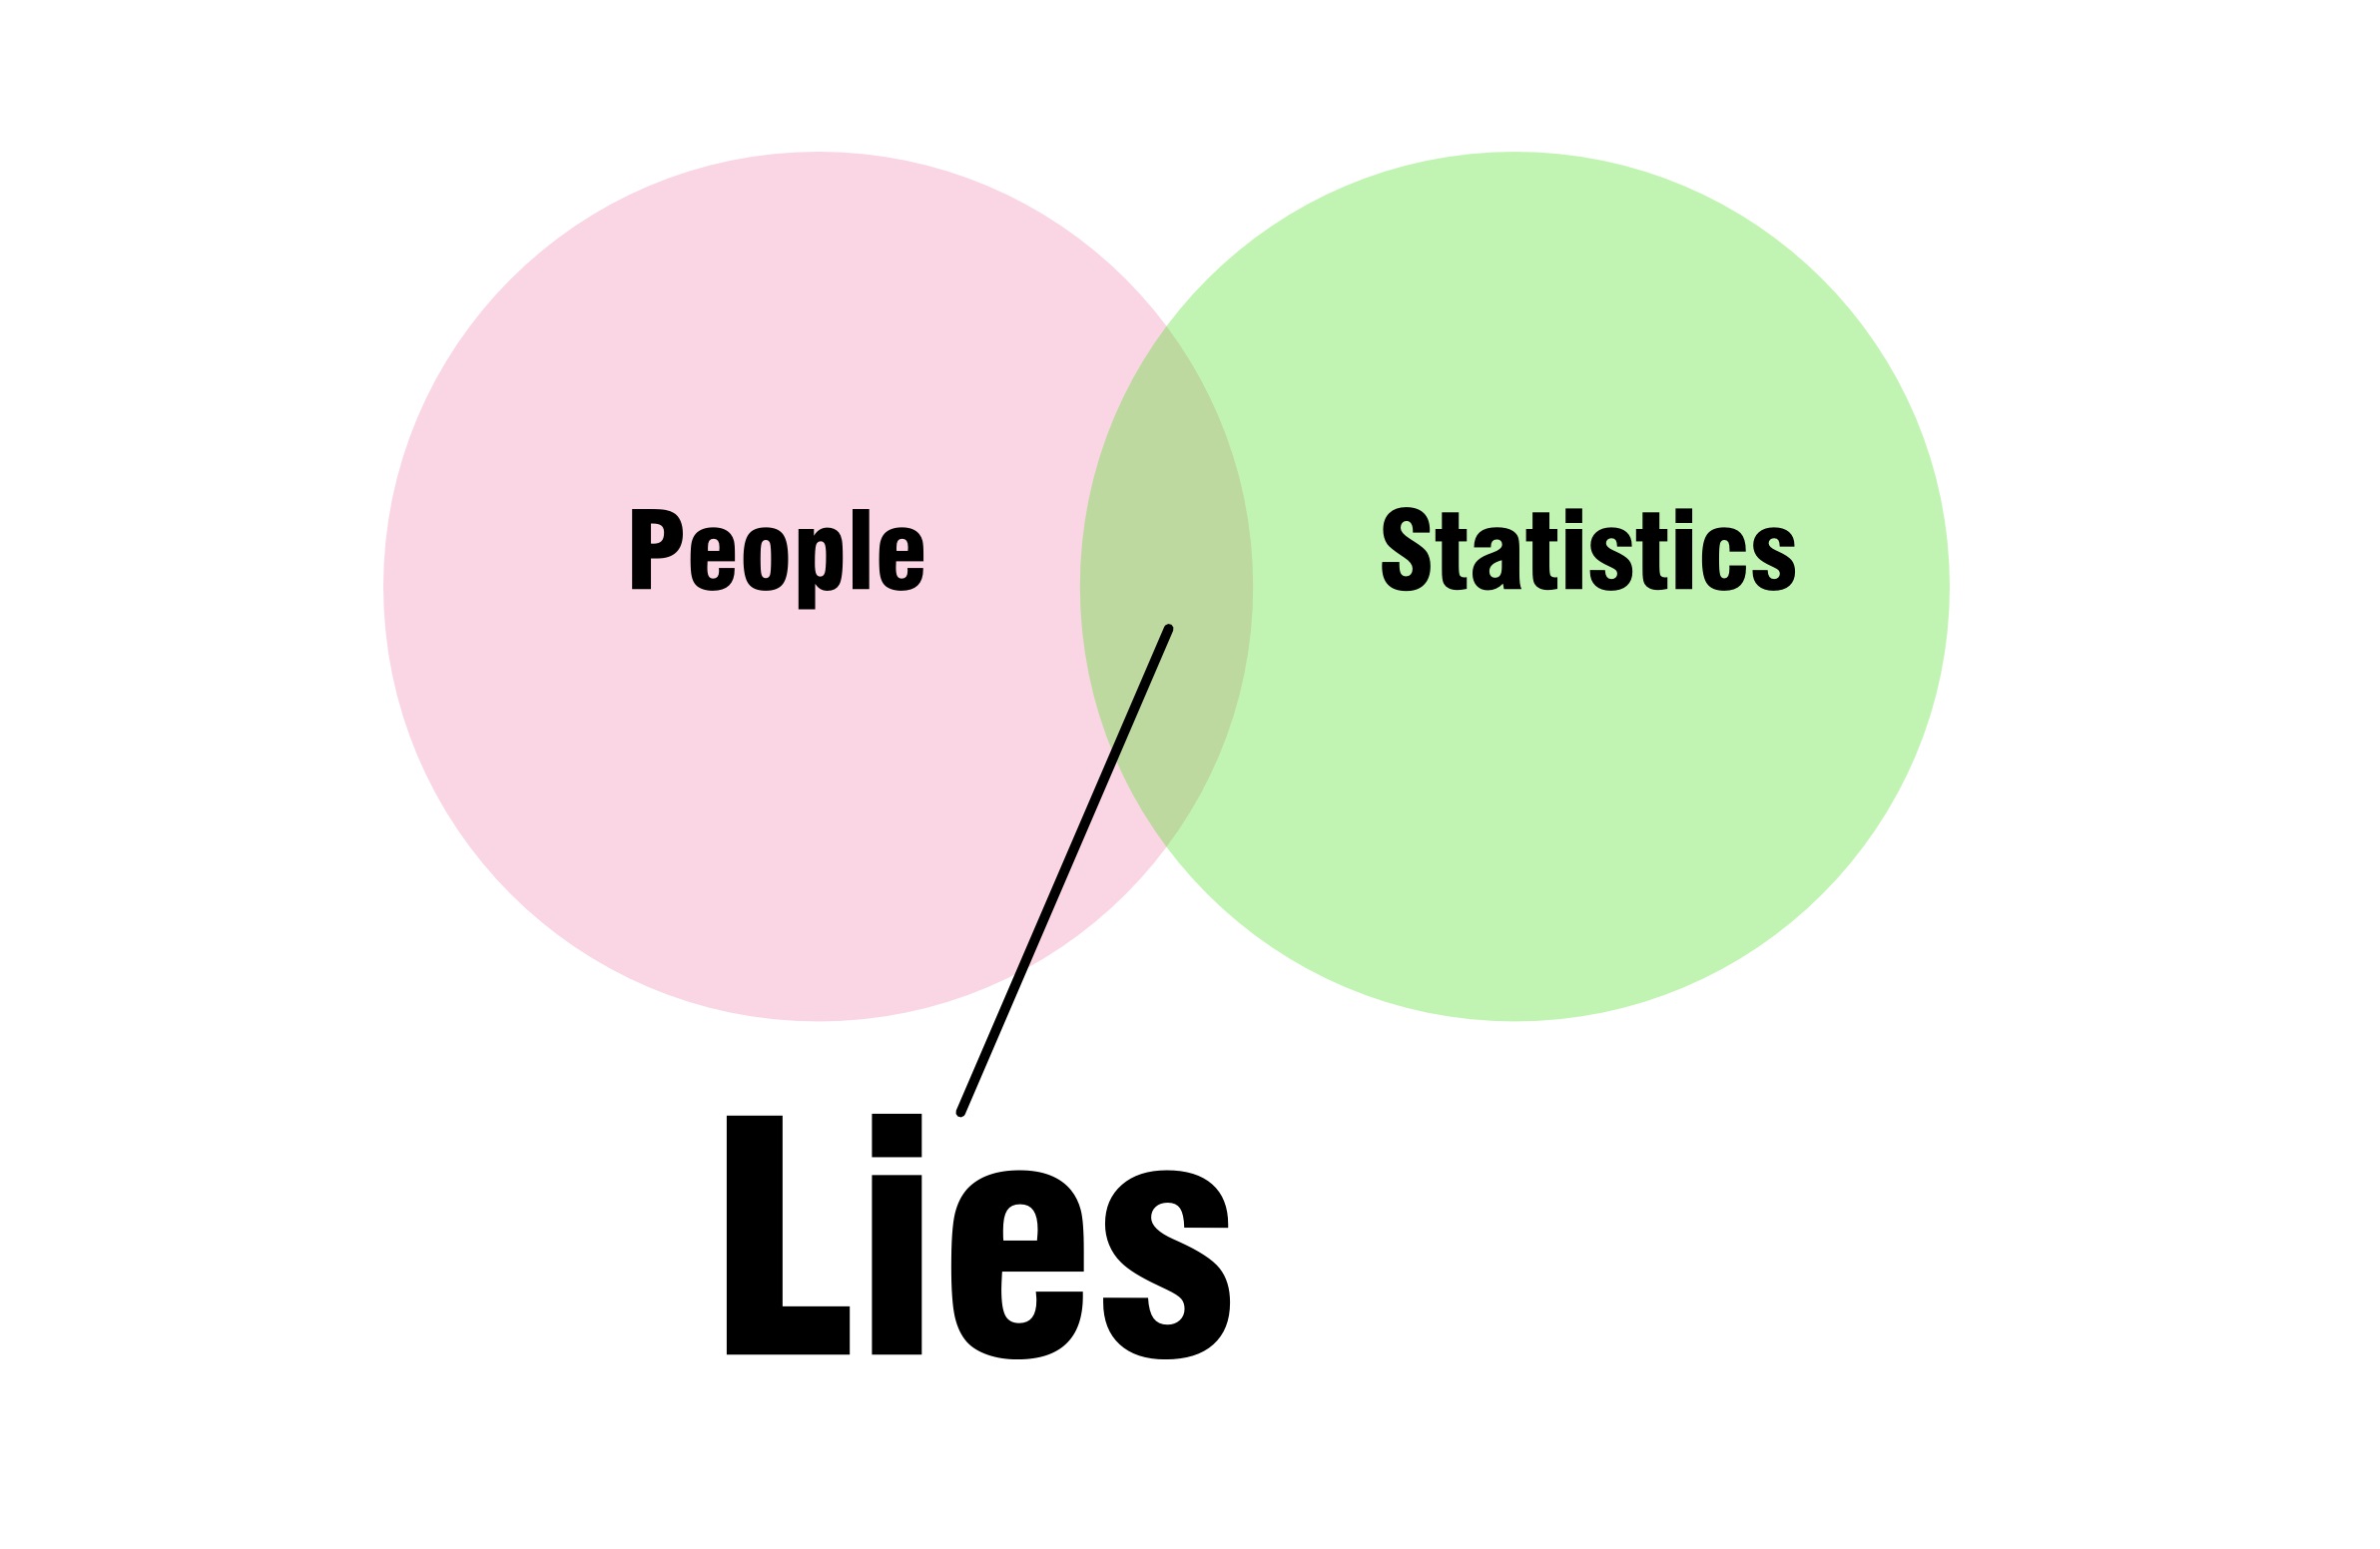
This article is a review of Darell Huff’s book ‘How to lie with statistics’.
First of all, this book is hilariously fun. Yet, the subject is important. Huff in the introduction emphasized why we should know the flaws in statistics. In his own words, he said “honest men must learn them in self-defense”.
The first chapter explored on how sample that have been chosen determined the final product of statistical analysis. Random sample is crucial to produce a fair an unbiased result. A truly random sample is very expensive and hard to get. That is why Huff said “you can’t win”. Statistics also are not safe from interpretation, statisticians interpretations may not the same as what the public understands or defines certain things. As an example of this, Huff said “the word ‘average’ have a loose meaning”. This loose meaning can present a misrepresentation, whether unintentionally or intentionally.
Talking about the sample, which we already discussed, that it needs to be random, the other important aspect of a sample is that, it need to be big and broad to represent the correct whole results. If we heard that a survey said that “50% of men own a Ferrari”, we should ask “which men?”. The hard question as Huff pointed out, is, how big is big?
Another myth Huff help uncover is on the effect of average. For example study on a pool of babies might come up with an average of age a baby should start walking. Say the figure is 1.25 years old. Parent who read this figure might think their baby is slow or retarded if they start walking after 1.25 years. The fact is, there are high chances that none of the babies from the sample pool start walking at exactly 1.25 year. It is just a figure that came when you do the arithmetic average. The right way to approach this, is by giving the range of normal age in which babies start walking, instead of a singular decimal.
The use of graphic to represent a set of data makes ‘manipulation’ easier. As saying goes ‘seeing is believing’. The drawing will gave a different impression even though below the drawing precise numbers are written. So you can compare two set of data that said that one is twice as big as the other, but the optical illusion will gave the reader an image of four times bigger. That image have a lasting effect compare to the numbers quoted.
Deception also can be used by the means of attaching, as Huff said, ‘the semi-attached figure’. You can say for example ‘this product is 50% more effective to reduce migraine’, but apart from the figure, the details are left out. The number can mean anything if concrete details are not given. Maybe the original studies is tested onto ‘lab rat’, who knows that rat also can contract migraine. And maybe the effect on human are not the same from the result produced by the rat.
Say for example your company profit last 2 years was $100, last year was $200 and this year, its $300. You can say that your company grow by $100 each year. That is honest, but it’s not interesting. You can divide your current year’s profit from the previous year and come up with more interesting representation. A 150% increase in profit. Or, you can use last 2 years profit, which will give you a smaller base and more impressive percentage. 300% increase in profit compare to last 2 years! So you can choose whichever way to represent your exact data, depending on purpose at hand.
Statistics also frequently help misled people on relationship between two set of data, Huff mention it as “assumptions of causality”. For example study shows that more people died in accident in weekdays on the road during the evening compared to driving during the night. We may think that driving in the evening cause accident. What the statistics did not mention is that more people driving in the evening back from work, of course more cars will gave a higher number of accidents.
In conclusion, Huff recognized that statistics should not be thrown out of the window, we still need them to make predictions and informed future decisions, statistics is better than our wild guess. The catch however, is to always be skeptic and ask questions. Don’t rush into conclusion without finding how the figure is derived and what does it actually mean. We also need to find, what have been left out of the stories, and how the conclusion would be if we take them into account.
Related Posts
Author of several books including Berfikir Tentang Pemikiran (2018), Lalang di Lautan Ideologi (2022), Dua Sayap Ilmu (2023), Resistance Sudah Berbunga (2024), Intelektual Yang Membosankan (2024), Homo Historikus (2024), DemokRasisma (2025), dan Dari Orientalisma Hingga ke Genosida (2025). Fathi write from his home at Sungai Petani, Kedah. He like to read, write and sleep.


Leave a Reply